Pollen Tracker
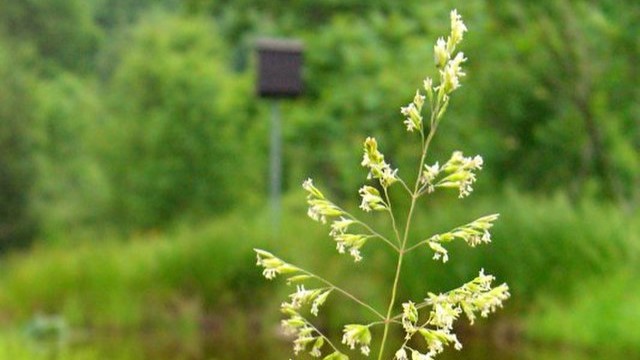
Spring in the Willamette Valley is a time of lovely weather, blooming wildflowers, and toxic air. Wait - what? Well, if you're as allergic to pollen as I am, this is a time that features some of the highest pollen counts in the United States, so toxic air is only a slight understatement. I suppose one could expect as much in the so-called Grass Seed Capital of the World.
I've gotten plenty of experience, then, strategically planning when to go outside. The pollen count data provided by the Oregon Allergy Associates has been invaluable in this effort. However, they only provide a daily count, and I know firsthand that there is plenty of sub-daily and smaller scale variability in the pollen counts. Sometimes, even on the highest allergy days, I would be fine on my bike ride to work, but on the way home I would get destroyed by pollen.
I began to notice, anecdotally at least, that when the winds were out of the east and north, I experienced more allergy symptoms than when they were out of the west. Since Corvallis is nestled right by the mountains on the west of the Valley, I figured that westerly winds were bringing relatively low pollen air from the Coast Range, while easterly winds brought the oh-so-toxic, pollen-filled air from the commercial fields in the central Willamette Valley.
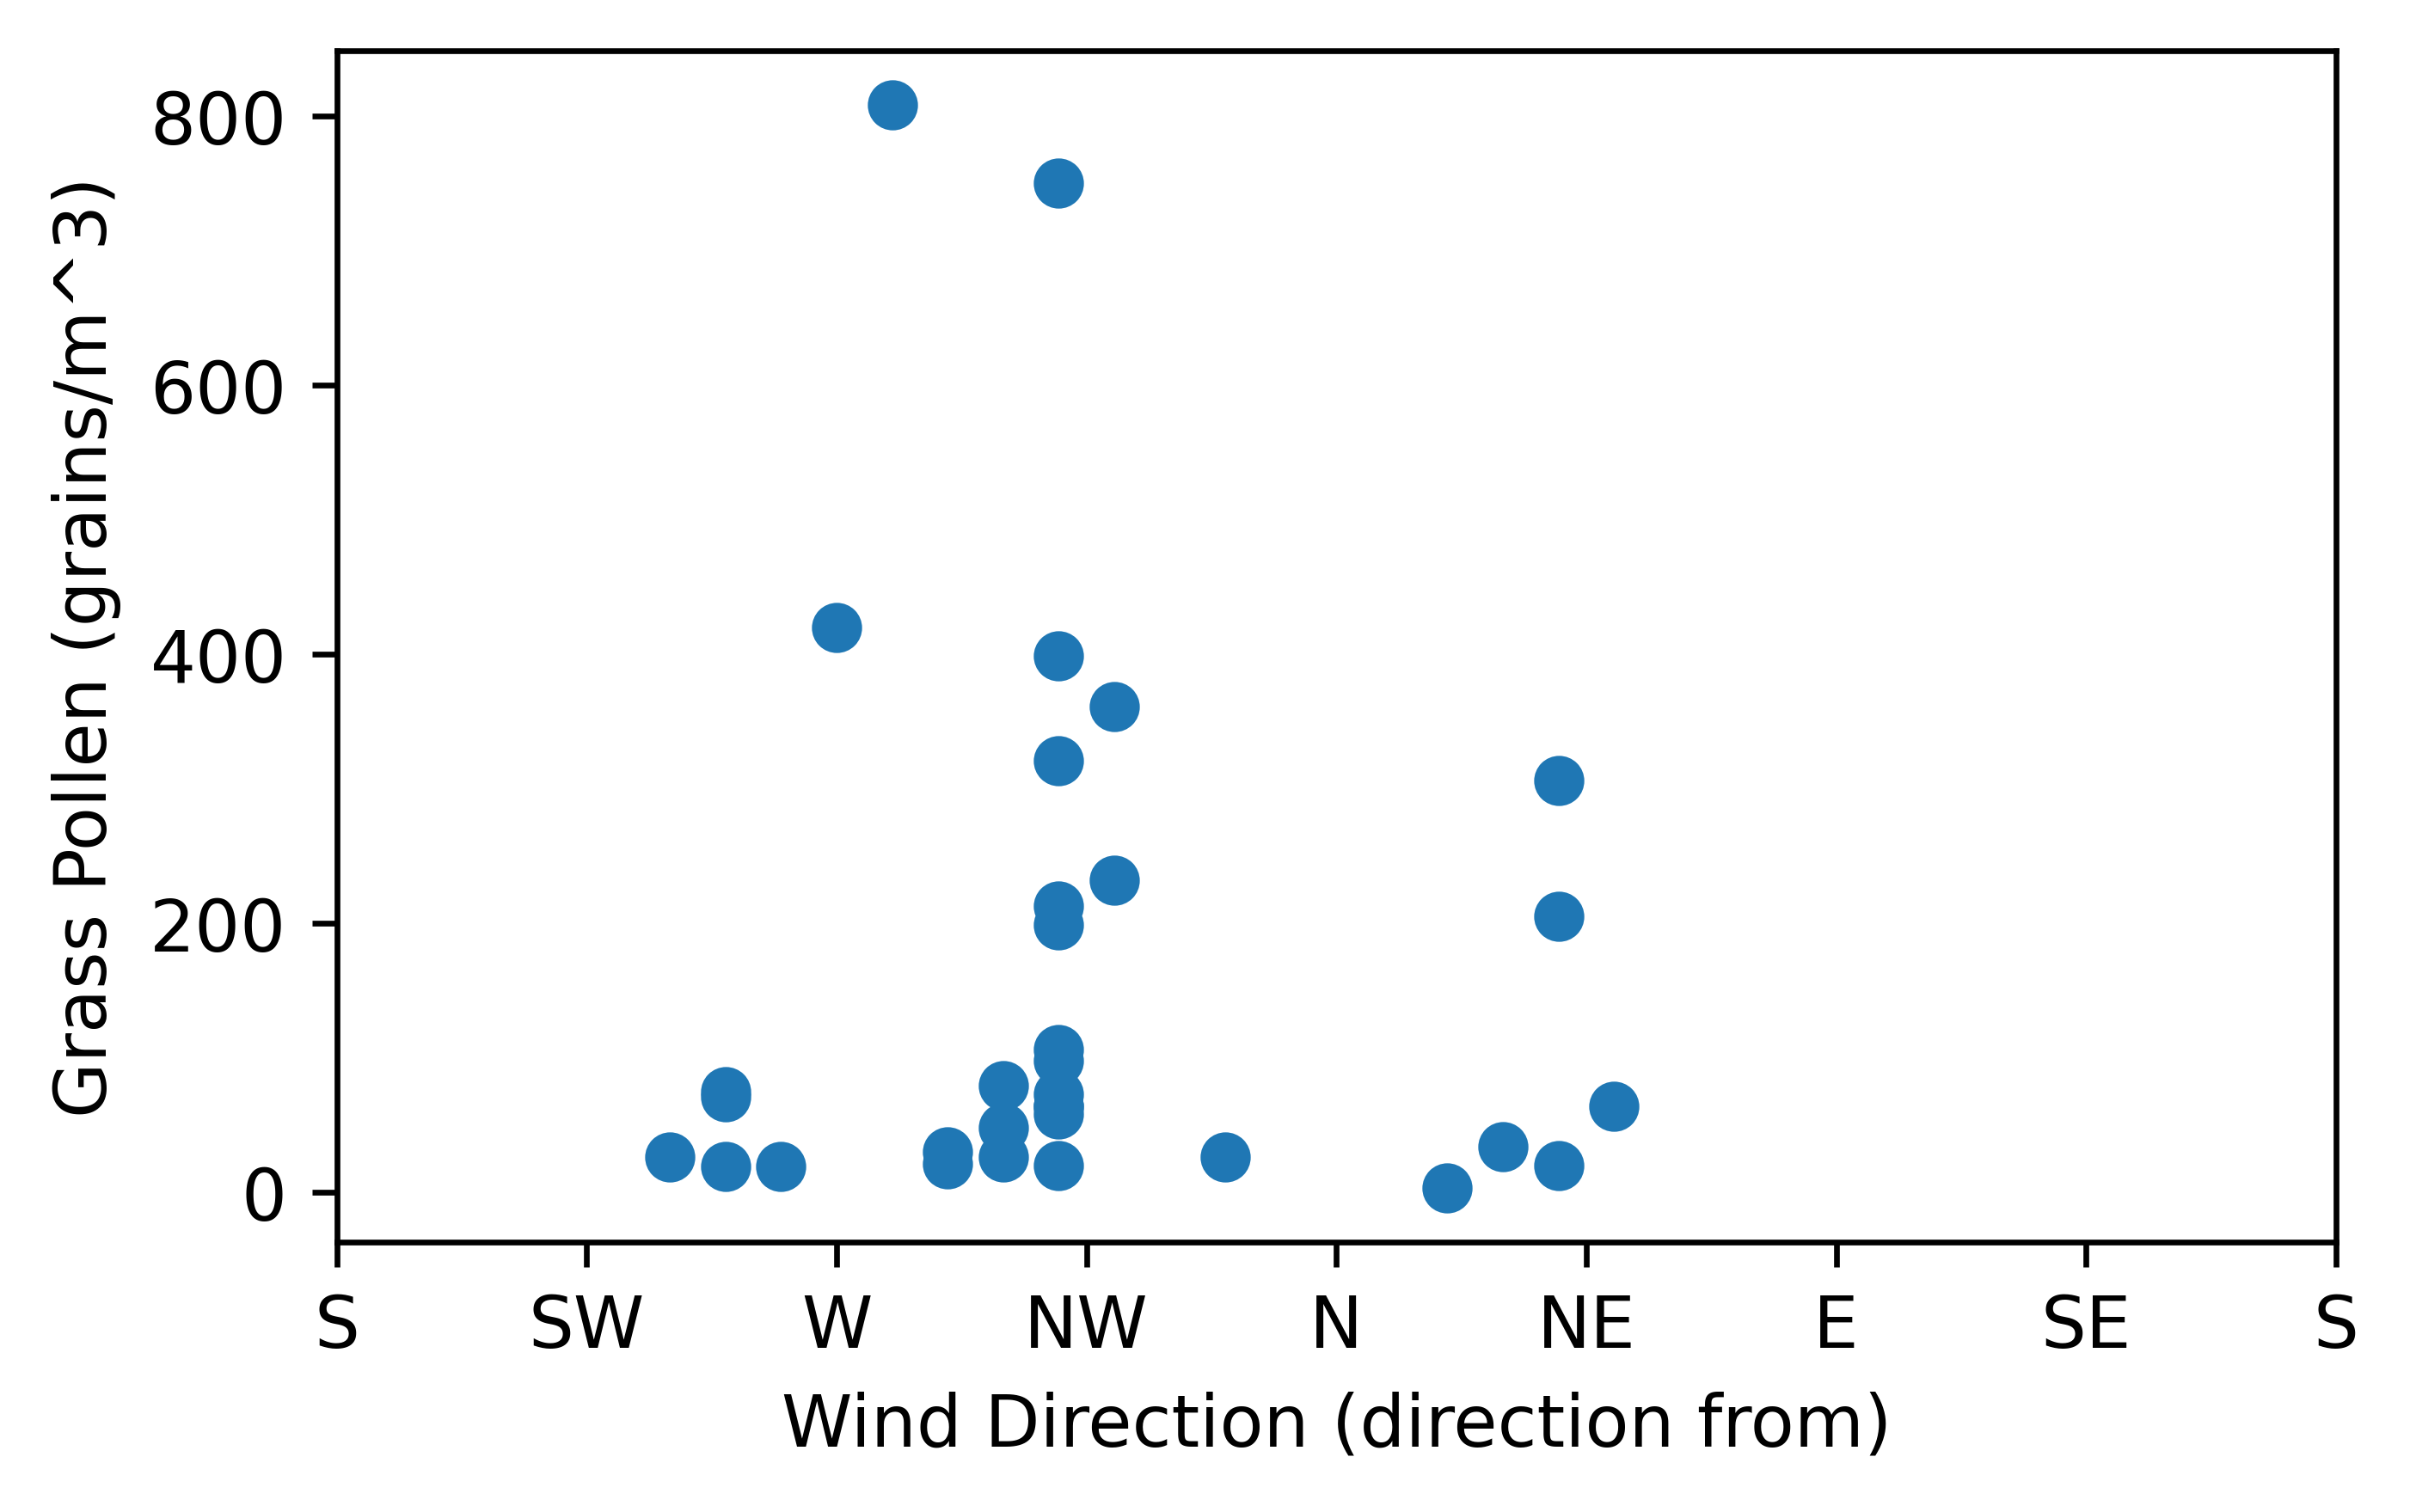
I decided to test this theory using local wind data and a record of pollen counts that I began storing this year (if you also want to access NCEI climate data such as winds, consider using my Python command line tool). The only winds available through the NCEI climate data are the direction of the strongest wind for each day, which isn't ideal for investigating small scale variability. Regardless, I hypothesized that wind direction would be correlated with the pollen counts. No such correlation was found. However, considering that the pollen counts are taken in Eugene (80 km south of Corvallis), and there is significant sub-daily variability, these results don't necessarily discount my anecdotal experience.
There does seem to be a weak correlation with the daily maximum temperature, which is expected. However, while temperature might be closely related to the onset and intensity of pollen season, I'm not convinced based on the literature or my experiences that temperature is the main driving force of smaller scale variability in pollen. Unfortunately, the data isn't really readily available to answer that question it seems. If anyone has an idea of where to find hourly wind data in the Willamette Valley, get in touch! In the meantime, find the full time series of pollen counts, starting April 2024, below.